|
|
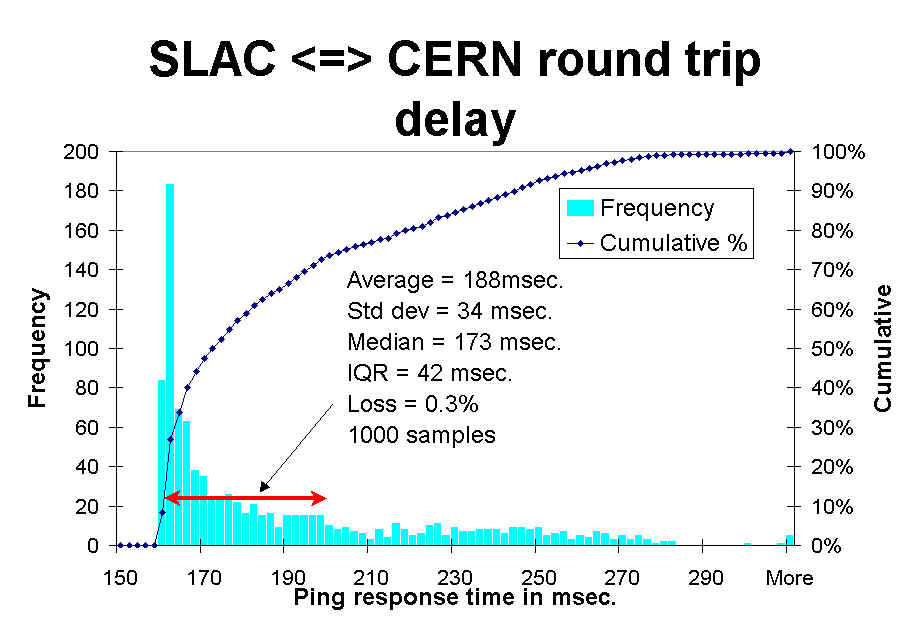
Round trip delay distributions between SLAC & CERN Les Cottrell, Warren Matthews and Connie Logg, Last Update: December 24, 1998 Central Computer Access | Computer Networking | Internet Monitoring | ICFA-NTF Monitoring |
|
 .
.
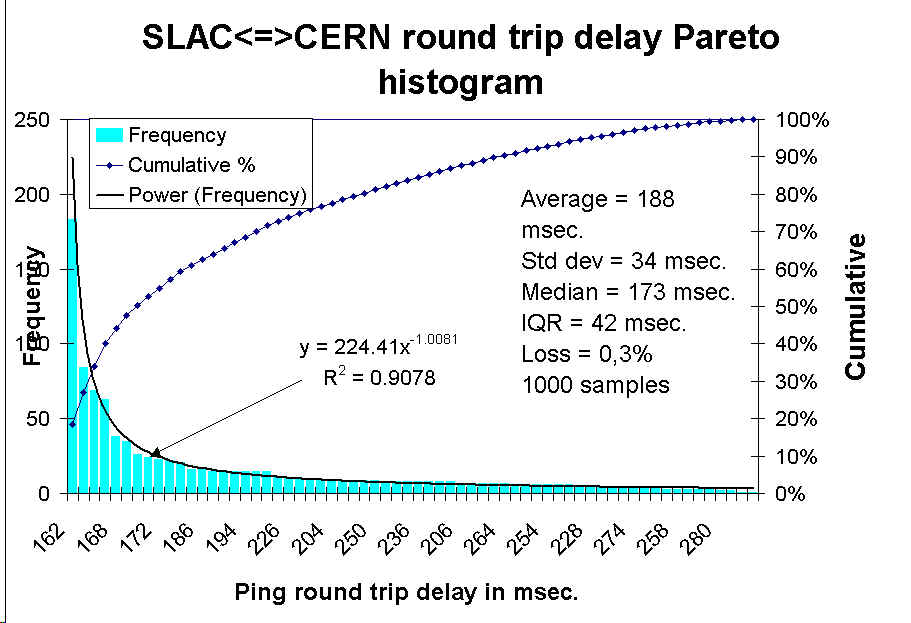
The next chart shows a Pareto distribution of the same data together with a power
series fit with shape parameter 1.0081. For more on the Pareto
distrbution see An Introduction to Probability Theory and its
Applications, William Feller, volume II, Wiley Esatern Ltd., 1988 and
Statistical Process Control, John S. Oakland, 1996,
Butterworth and Heinemann. This fit has an R2 which
indicates a good fit. A shape parameter <= 2 means that the distribution has
an infinite variance, indicating immense variability. Pareto distributions for
activity and inactivity periods play key roles in models of self-similarity (see
W. Willinger, V. Paxson and M. Taqqu, Self-Similarity and Heavy Tails: Structural Modeling of Network
Traffic in A Practical Guide to Heavy tails: Statistical Techniques
for Analyzing Heavy tailed Distributions, to be published by Birkhauser,
1997.)
 .
.