 Degradation of Long Term WAN Performance
Les Cottrell, Last Update: January 24, 1997


[
SLAC Computer Services (SCS) |
Network Group |
Computer Networking |
WAN Monitoring
]
Introduction
Performance between University node and ESnet nodes degraded badly
in 1995-1996. Two metrics which can be used to illustrate this are
the round trip response time for a ping packet, and the packet loss for ping
pacekst. Examples of these metrics measured between SLAC and
UC Davis are shown below.
In these plots the X axis has one point per day for the 180 days from 11/12/95
thru 5/15/96.
- The plot of
SLAC <-> UCDavis Ping Response Nov95 - May96
shows the average daily 1000 byte payload
ping response times
between SLAC and UC Davis between November 1995 and May 1996. The plus
signs (+) are the average weekday measurements and the
circles (o) are the weekend measurements. The lines are linear regression fits
to aid the eye.
- The plot of
SLAC <-> UCDavis Ping Packet Loss Nov95-May96
shows the average daily 100 byte payload ping packet loss between
SLAC and UCDavis between November 1995 and May 1996. The plus
signs (+) are the average weekday measurements and the
circles (o) are the weekend measurements. The lines are linear regression fits
to aid the eye.
You can observe over a factor of 3 degradtion in the performance
for the response time and packet loss metrics for this 6 month period.
You can also observe that the weekend responses times and ping losses were
lower than the corresponsing weekday measurements. Also the differences in the weekend
and weekday response times and packet losses increased during this 180 day timeframe.
The differences in the weekend and weekday measurements
may indicate that the some of the cause of the problem is
saturation of the links during the weekdays.
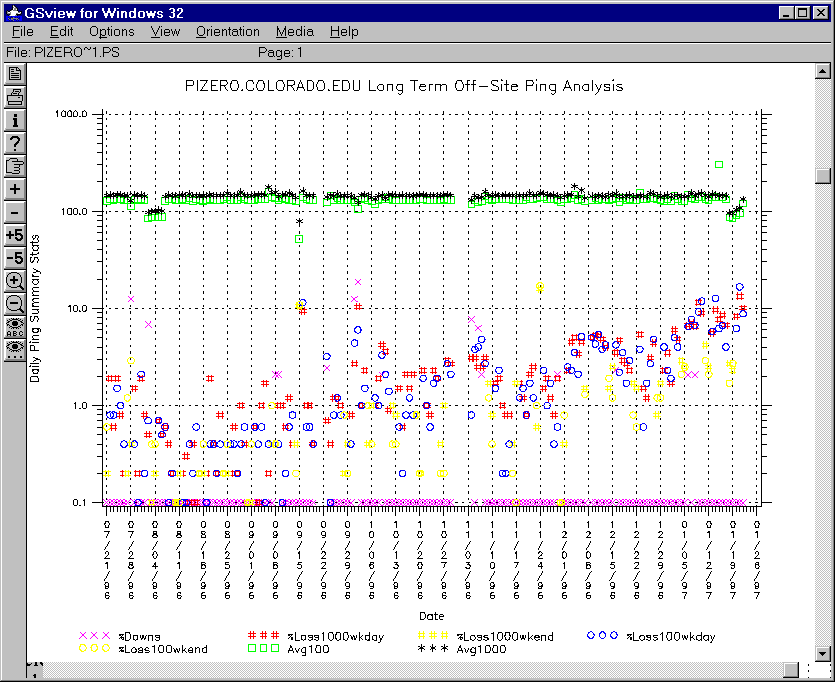
To provide more information in a single plot we include both the response times
and the packet loss in a single plot and use a logarithmic y axis. Examples of
such plots are shown below.


[
Feedback |
Reporting Problems
]
Owner: Les Cottrell

