|
|
Comparison of one and two way jitter Les Cottrell Last Update: January 7, 1998 Central Computer Access | Computer Networking | Internet Monitoring | Tutorial on Internet Monitoring |
|
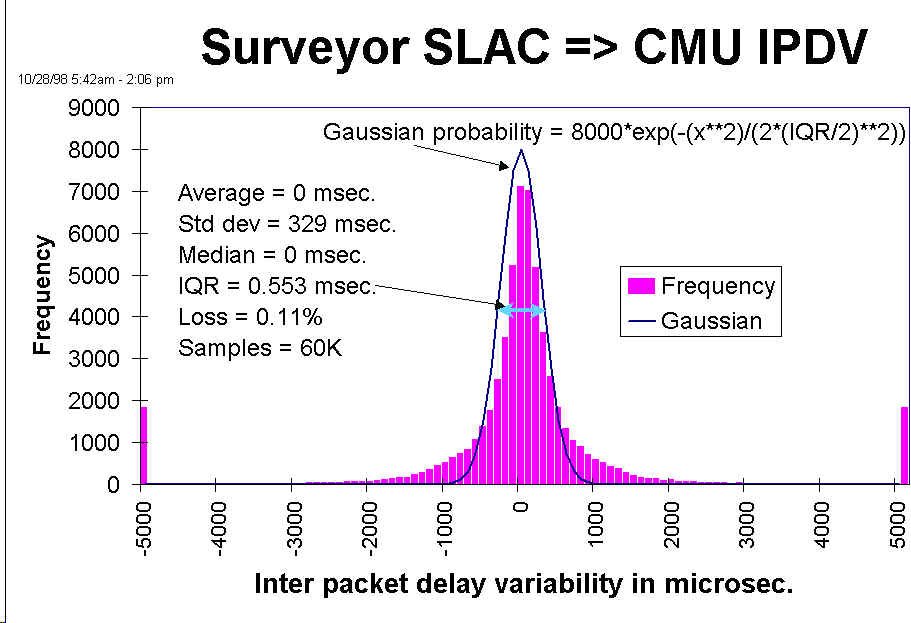
Traceroute from SLAC to CMU
 1  RTR-CGB5.SLAC.Stanford.EDU (134.79.19.3)  1.222 ms  0.863 ms  0.782 ms
 2  RTR-DMZ.SLAC.Stanford.EDU (134.79.11.4)  1.574 ms  1.801 ms  1.507 ms
 3  ESNET-A-GATEWAY.SLAC.Stanford.EDU (192.68.191.18)  1.240 ms  1.073 ms  0.976 ms
 4  chicago-atms.es.net (134.55.24.17)  51.173 ms  50.917 ms  50.369 ms
 5  204.147.128.217 (204.147.128.217)  63.010 ms  60.975 ms  62.692 ms
 6  cs-atm0-0-11.psc.vbns.net (204.147.130.41)  69.834 ms  70.529 ms  71.168 ms
 7  garcia-72.psc.edu (128.182.72.16)  71.735 ms  70.385 ms  70.078 ms
 8  140.173.6.78 (140.173.6.78)  71.664 ms  71.744 ms  70.557 ms
 9  STERNUM-FA6-0-0.GW.CMU.NET (128.2.0.10)  71.801 ms  71.221 ms  72.232 ms
10  * * NETSERVER.NET.CMU.EDU (128.2.35.50)  73.180 ms

Traceroute from CMU to SLAC

 1  RTRBONE.NET.CMU.EDU (128.2.1.2)  1.771 ms  1.624 ms  1.545 ms
 2  CS.GW.CMU.NET (128.2.0.254)  1.733 ms  1.83 ms  1.828 ms
 3  garcia-gp.psc.net (198.32.224.16)  3.674 ms  3.461 ms  3.94 ms
 4  vcisco.psc.edu (128.182.72.47)  3.346 ms  3.155 ms  3.047 ms
 5  cs-atm0-0-7.sdsc.vbns.net (204.147.129.77)  63.567 ms  63.242 ms  64.229 ms
 6  gac-sdsc.es.net (198.129.78.14)  81.23 ms  75.694 ms  75.879 ms
 7  slac-atms.es.net (134.55.24.13)  72.006 ms  71.927 ms  71.626 ms
 8  RTR-DMZ.SLAC.Stanford.EDU (192.68.191.17)  74.397 ms  73.538 ms  76.004 ms
 9  * * *
10  MINOS.SLAC.Stanford.EDU (134.79.196.100)  75.103 ms  75.918 ms  75.33 ms
The calculation of inter packet delay differences follows the IETF draft on Instantaneous Packet Delay Variation Metric for IPPM. The inter packet delay difference is denoted as dD, where dDi=Di-Di+1 and Di is the measured one way delay for measurement i. The chart also shows values for various statistics of the distribution. To characterize the variability of the inter packet delay differences (or jitter) we use the Inter Quartile Range (IQR), i.e. the distance between where 25% and 75% of the measurements lie. A Gaussian probability curve with the same IQR and peak height as the measured data is superimposed on the data. It is seen that the data has a sharper peak and yet wider tails than a Gaussian distribution.
 .
.
The next chart shows a snapshot (for the same period as the above figure) of
the frequency histogram
of the inter packet delay differences measured by Surveyor from CMU to SLAC.
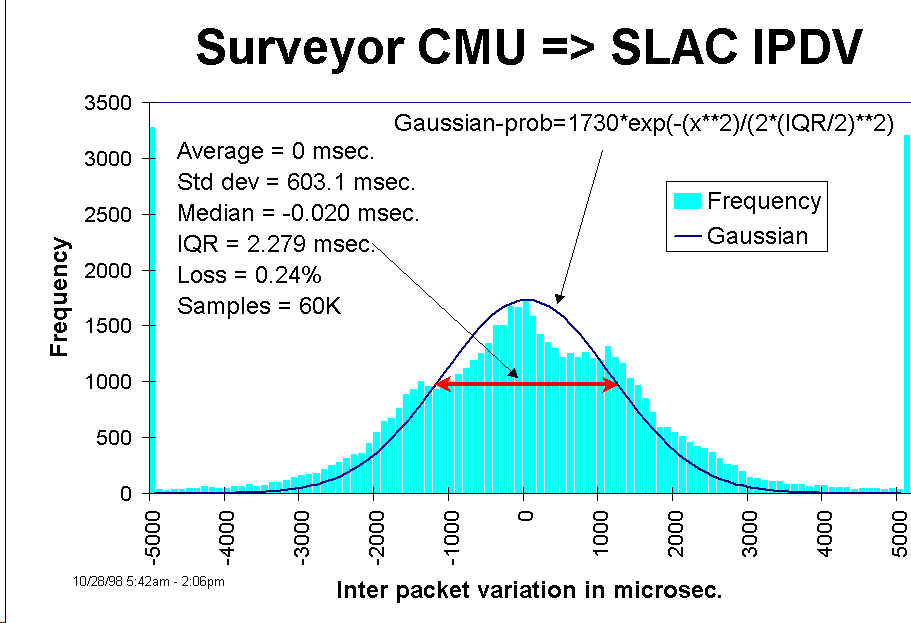 . By comparing the charts above and
below it can be seen that
the jitter can be quite different between the two directions.
. By comparing the charts above and
below it can be seen that
the jitter can be quite different between the two directions.
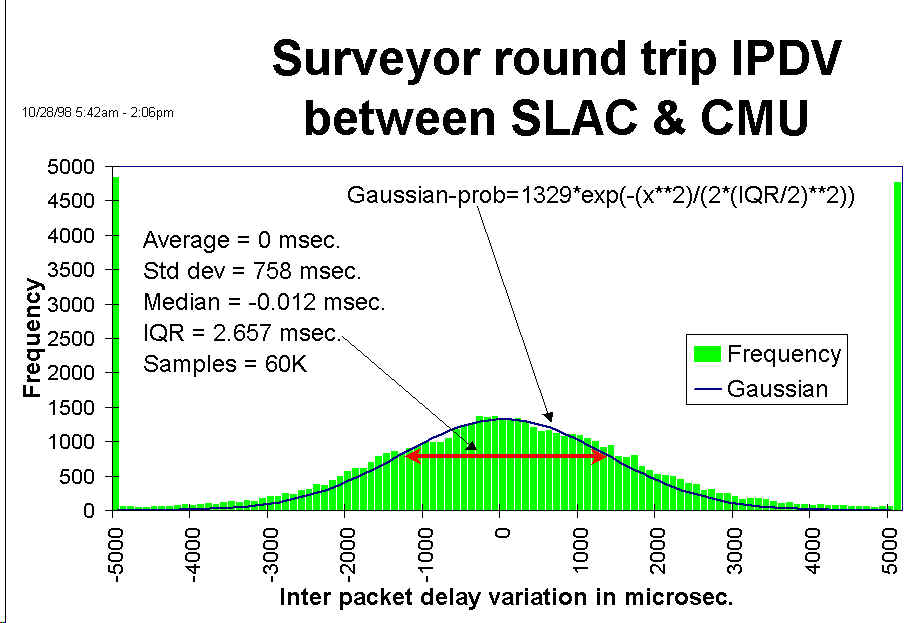
By adding together the one way delays of SLAC->CMU
to CMU>SLAC for similar time stamp measurements we can get an estimate of the round-trip delays.
The chart below shows the inter packet round trip delay differences between SLAC and CMU.
A rough estimate of the round trip for the inter packet delay differences IQR
can be obtained by taking the one way
inter packet delay difference
(Ja=>b and Jb=>a) where the subscript
a=>b
indicates the monitoring node is at a and is monitoring a remote node at
b.
Then we add the two one way delays for equivalent
time stamps together and derive the IQRs for the round trip delay
(Ja<=>b) and inter packet delay difference
(Ja<=>b). We find that a reasonable approximation
to the round trip IQRs can be derived from the one way IQRs by:
Ja<=>b = 0.5 * (sqrt(Ja=>b2 +
Jb=>a2) + Ja=>b + Jb=>a)
.
In the above case the measured IQR from the bottom chart is 2.66 msec. while the derived value
from
the above formula is 2.59 msec.